
August worst month on record for PH COVID-19 outbreak, but there is reason for hope
Posted at Sep 04 2020 07:35 PM
MANILA – August was the worst month yet in the Philippines’ fight to contain COVID-19.
More than 128,000 COVID-19 cases were confirmed in August, more than the total number of cases from January to July combined. It was within the same month that infections in the country surged past 100,000 and 200,000.

This chart shows the surge of COVID-19 cases last month. It was during August that the COVID-19 outbreak in the Philippines officially became the worst in Southeast Asia.
This isn’t hyperbole.
This isn’t a dramatic exaggeration.
This is fact.
How did we get here?
Let’s look at the numbers.
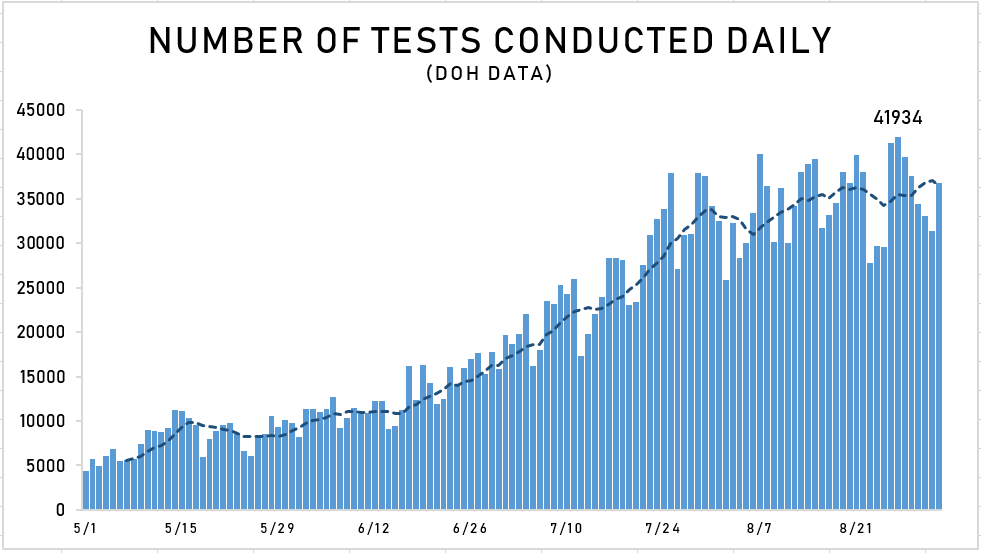
The Philippine government ramped up testing in August, averaging nearly 35,000 a day for the month. There was even a day where nearly 42,000 tests were conducted. Overall, August had more than 30,000 tests in 25 out of the 31 days. This is a great sign.
The ramped-up testing effort means the government is finally getting a more complete picture of the COVID-19 outbreak in the Philippines. All of the data obtained in August presents a much clearer and complete picture of conditions on the ground, especially when compared to the earlier months of the pandemic.

The government’s efficiency in COVID-19 testing and validation of testing results also greatly improved in August. This chart compares positive tests in dark red and confirmed cases in lighter red. Positive tests outnumbered confirmed cases in May, June, and July. The validation backlog in confirmed cases was particularly pronounced in July, as shown by the big disparity in the chart.
In August, confirmed cases outnumbered positive cases. This means the laboratories and medical personnel working on COVID-19 testing have finally caught up with the ramp up in testing, and have even managed to cut into the backlog of unconfirmed cases from previous months. It is a great effort on their part when you consider how much testing has increased over the last few months.
But is the government’s progress in testing and validation the only reason behind the increased number of COVID-19 cases?

This chart shows the positivity rate, which is the number of positive cases divided by the number of individuals tested. The bar graphs in orange show the daily positivity rates while the blue line reflects the 7-day moving average. As testing increases, the denominator for the rate increases. This means more testing should actually result in a lower positivity rate, provided there are less positive cases to be found.
A higher positivity rate could mean local transmission of COVID-19 is actually outpacing testing efforts. This looked to be the case in July and in the first half of August. But in the last 2 weeks of August, the positivity rate actually started to level off.
The positivity rate is still elevated at above 10 percent, still far from the World Health Organization benchmark of 5 percent or lower for at least 2 weeks. But the fact that it is on a downward trend is very encouraging. Not only are we getting a more complete picture of conditions on the ground thanks to better testing, that picture is showing local transmission of COVID-19 could be slowing.

This chart shows us the number of recoveries (green) from COVID-19 as of Sept. 3. The government has regularly reported time-based recoveries every Sunday. This has resulted in an uneven and jagged-looking chart, which is not ideal for finding trends in the data.
However, it should still be noted that the number of recoveries have greatly increased, subsequently decreasing the number of active COVID-19 cases as well. The black line shows the number of deaths. This has thankfully remained low relative to total COVID-19 cases, but still, one death is one too many. And late reporting of deaths has been an issue in recent weeks.

This chart reflects hospital capacity data, specifically the occupancy of intensive care unit (ICU) beds dedicated for COVID-19 patients. It still appears elevated in key areas such as the National Capital Region (NCR) and Calabarzon. But these levels are now lower compared to previous months.

This chart better illustrates the improvements, tracking ICU bed occupancy in NCR (blue), Central Visayas (orange), and Calabarzon (green). These are all economically important areas, which have elevated levels of COVID-19 cases. They all had ICU bed occupancy rates above the 70 percent danger zone level in previous months, but they are all now below that threshold. Central Visayas is now in the safe zone (less than 30 percent occupancy).
August was the worst month for the Philippine COVID-19 outbreak in terms of total COVID-19 cases reported. But the Philippine government also made significant gains in testing efficiency, case validation, hospital capacity, and COVID-19 containment.
Still, this is no reason for celebration. The fight to contain COVID-19 must continue, and the gains achieved in August must be sustained. Those gains may be attributed to the return to tighter quarantine conditions in NCR and surrounding areas for half of August. Those lockdown conditions are no longer there, and the Philippine economy cannot afford a return to stricter restrictions.
If the gains are to be built upon, everyone must do their part to keep COVID-19 from spreading.
